
You stare at your buyer journey analytics dashboard, but you don’t see what you’re looking for…
In product management and customer experience, there’s a dangerous trap that catches even seasoned professionals: measuring everything while understanding nothing.
The truth is, measuring improvements from buyer journey reporting isn’t about tracking every possible metric—it’s about tracking the right metrics at the right time and understanding what they actually tell you about your customer’s experience. Through thoughtful customer journey analysis, you can uncover where value truly exists and where friction hides.
Get this: 64% of contact center leaders admit their KPIs don’t reflect real customer experience, while just 16% feel they have the data needed to truly know their customers.
Therefore, it’s time to measure what really matters. To measure buyer journey performance in ways that bring clarity instead of confusion.In this guide, our lifecycle marketing experts break down exactly how to do it. Let’s go!
Laying the foundation: What you’re actually measuring in customer journey analysis
Before we get into the metrics, we need to establish a critical distinction that many organizations miss: the difference between how your customers perform for your company versus how your company performs for your customers.
Traditional business metrics—your KPIs—focus on the former. They measure conversion rates, average order values, and customer acquisition costs from the business perspective. But if you want to genuinely improve the buyer journey, you need to flip the script and ask: “How would our customers measure our performance?” This approach, using Customer Performance Indicators (CPIs) alongside traditional KPIs, creates a more complete picture of journey health.
When both indicators improve simultaneously, you know you’re making real progress.
The CX journey funnel: Your buyer journey measurement framework
The buyer journey naturally breaks down into distinct phases, often referred to as the AARRR framework: Acquisition, Activation, Engagement, Retention, Referral, and Monetization. Each phase requires different sales funnel metrics because each represents a fundamentally different relationship between your buyer and your product or service.
Think of these phases as checkpoints in a relay race.
Measuring only the finish line (monetization) tells you nothing about where runners are dropping the baton. You need measurements at each handoff to identify what’s working and what’s not.
1. Acquisition: Are you attracting the right buyer?
At the top of your funnel, acquisition metrics tell you whether your improvements are reaching your target audience effectively.
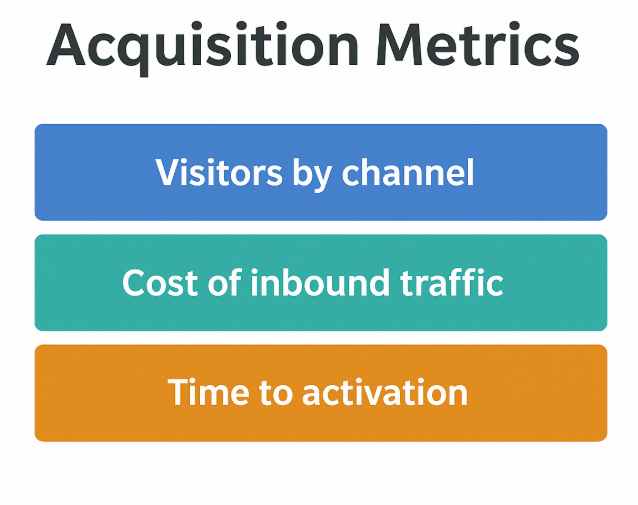
Key metrics to track:
- Visitors by channel: Don’t just track total traffic. Break it down by source.
- Cost of inbound traffic: Measure dollars spent per visitor (not per customer). A declining cost over time signals growing marketing efficiency.
- Time to activation: Track how quickly new visitors move from discovery to action. Faster conversion from days to minutes shows reduced friction and clearer value.
Here’s the crucial insight about acquisition: these metrics mean nothing in isolation. That’s why acquisition must always be measured in context with activation rates (and supported by buyer journey analytics to uncover patterns over time).
2. Activation: Are buyers taking the first critical step?
Activation is where casual browsers become potential customers. They’ve signed up for your newsletter, created an account, started a free trial, or taken whatever first committed action your business model requires.
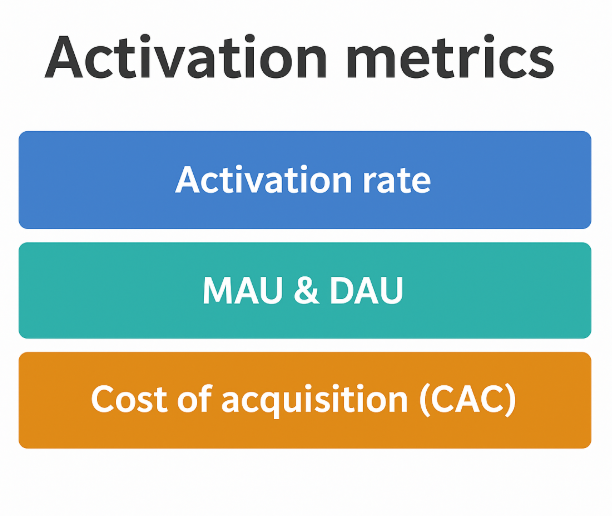
Key metrics to track:
- Activation rate: What percentage of visitors complete your activation step, and how is it trending?
- MAU and DAU: Track how many users return daily or monthly. Focus on growth trends.
- Cost of acquisition (CAC): Measure cost per activated user.
One critical distinction: activation measures activity, not engagement. That brings us to perhaps the most important phase of the buyer journey with respect to customer journey metrics.
3. Engagement: Are buyers finding real value?
This is where the rubber meets the road. Engagement metrics reveal whether buyers are actually getting value from your product or service—the ultimate measure of buyer journey success.
Here’s a principle that cannot be overstated: engagement is the earliest indicator of journey improvement. If people aren’t finding value in what you offer, nothing else matters.
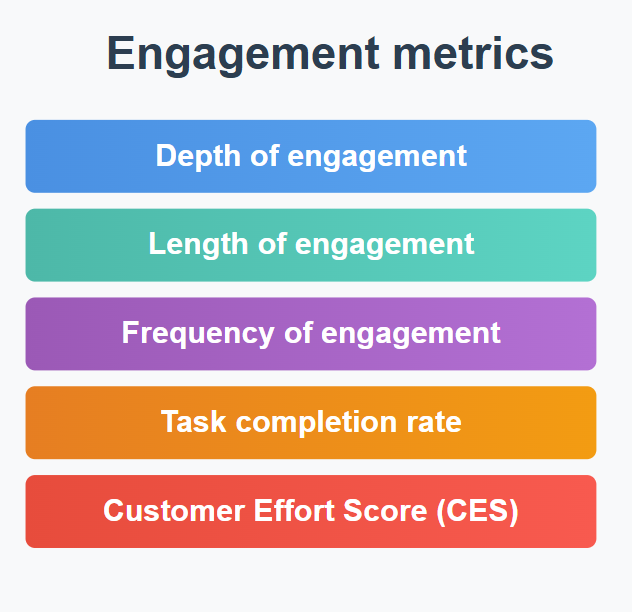
Key metrics to track:
- Depth of engagement: Identify the actions that show users are gaining real value and track those relentlessly.
- Length of engagement: Measure time spent, however interpret it through your product’s mission. Longer sessions may signal success for entertainment, while shorter ones may indicate efficiency for automation tools.
- Frequency of engagement: Track how often users return.
- Task completion rate: Monitor how often users achieve their goals.
- Customer Effort Score (CES): Measure how easy it is for users to complete tasks. Make sure to keep questions hyper-specific and transactional. Avoid using it in customer service or call centers. (What is a Customer Effort Score?)
Understanding these customer experience metrics helps ensure that improvements at this stage reflect real customer value, not just surface activity.
4. Retention: Are buyers coming back?
Engagement tells you about a single session or interaction. Retention tells you whether buyers see enough value to return repeatedly over time.
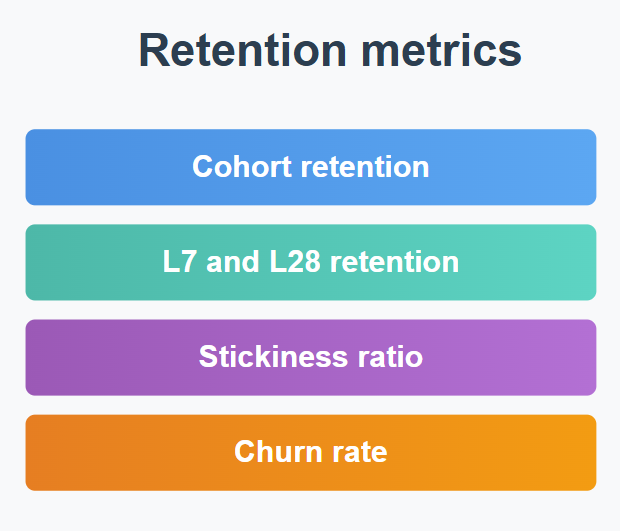
Key metrics to track:
- Cohort retention: Track buyer groups over time. For example, what percentage of January buyers repurchase within 30, 60, or 90 days? Compare cohorts before and after journey improvements to gauge impact.
- L7 and L28 retention: Measure how often buyers return within 7- or 28-day windows. This is ideal for digital products that track logins or recurring activity.
- Stickiness ratio: Shows what share of monthly users engage daily.
- Churn rate: The inverse of retention. What percentage of buyers drop off, and when? Pinpointing churn timing reveals where the journey breaks down.
Here’s a pro tip: don’t just measure whether buyers return, measure why they return. Execute customer journey performance tracking through exit surveys and reviews.
5. Referral: Are buyers becoming advocates?
Referral is your ultimate validation. When buyers voluntarily promote your product or service to others, they’re signaling that your journey not only met their needs but exceeded expectations.
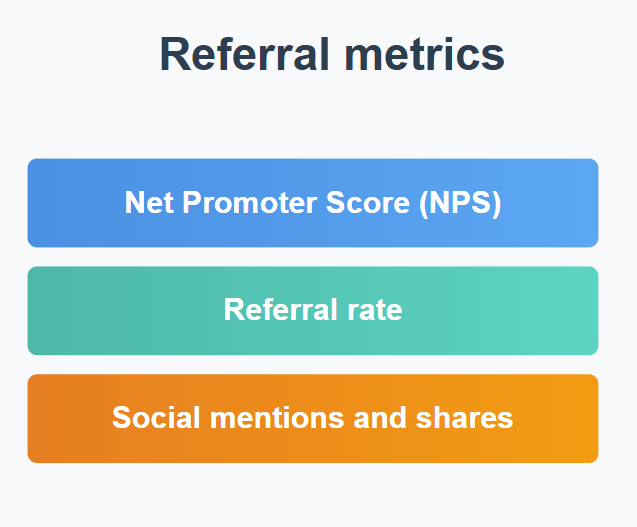
Key metrics to track:
- Net Promoter Score (NPS): Use it only for brand experience at a relational level. Skip all root cause questions. Add a shadow metric of average score for stability.
- Referral rate: Measure the percentage of buyers who refer others through programs, social sharing, or word-of-mouth.
- Social mentions and shares: Monitor unsolicited brand mentions and reviews.
A strong referral engine indicates that your customer journey analysis efforts have successfully turned satisfaction into advocacy.
6. Monetization
We reach the commercial reality: monetization. But here’s the key insight—if you’ve optimized all the preceding stages, monetization becomes much easier.
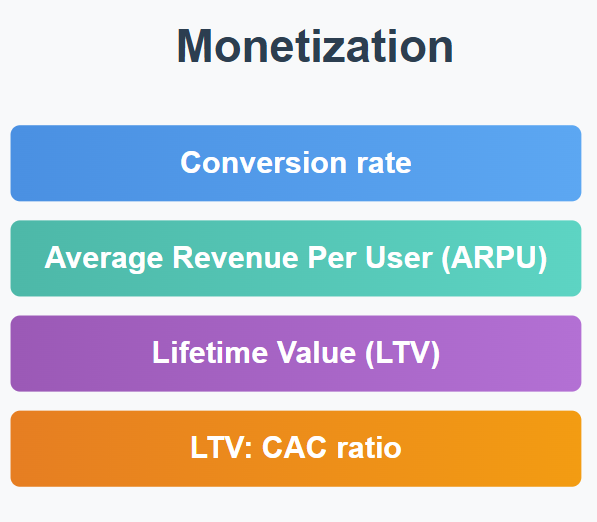
Key metrics to track:
- Conversion rate: The percentage of engaged users who become paying customers. Track this by cohort and over time to see if journey improvements are reducing friction in the purchase process.
- Average Revenue Per User (ARPU): Measure whether buyers are spending more over time. Rising ARPU after journey updates suggests customers are finding greater value and upgrading or purchasing more.
- Lifetime Value (LTV): The total revenue expected from a buyer over their relationship with your company. Though it takes time to show, it’s the ultimate indicator of journey success.
- LTV: CAC ratio: Shows whether your business model is sustainable.
👉 Please note that the AARRR framework is a model, and not a rigid sequence. Different business models place monetization at different points.
The critical principle: Sum of parts ≠ whole
Now here’s a sobering reality uncovered in customer experience research: Optimizing individual touchpoints doesn’t necessarily improve the overall journey.
Consider a simple example from the telecommunications industry:
A company measured high satisfaction at every touchpoint—phone calls scored well, technician visits scored well, email interactions scored well. Yet when they measured the end-to-end customer onboarding journey, satisfaction was low. Why? Because customers didn’t want nine phone calls, a technician visit, and multiple emails. They wanted simplicity.
This teaches us that you must measure both interaction metrics and outcome metrics.
Track how individual metrics improve, but always validate against the overall journey experience using balanced customer experience metrics that reveal hidden friction points.
Measure for meaning
While customer experience metrics are valuable, an obsession can be counterproductive.
As Sean Albertson aptly notes, “Great numbers don’t always equal great experiences.” Speaking about NPS, he explains, “While NPS can provide directional feedback, it’s often misused as a proxy for performance. Companies that obsess over their score sometimes miss the real systemic issues underneath like process bottlenecks, employee misalignment or cultural fatigue.”
We couldn’t agree more. Therefore, the goal isn’t to measure for the sake of it, but to measure buyer journey progress that translates into meaningful improvements.
Implementing your measurement strategy
Now that you’re aware which customer journey metrics to prioritize, start by mapping your current buyer journey and identifying which stage each buyer cohort occupies. Then:
- Select 2-3 key metrics per journey stage: Don’t try to track everything. Choose metrics that directly reflect the value proposition of that stage.
- Establish baselines: You can’t measure improvement without knowing where you started. Document current performance before implementing changes.
- Set improvement targets: Be specific and time-bound. “Increase activation rate by 15% within 90 days” beats “improve activation.”
- Track cohorts, not just aggregates: Compare buyers who experienced your improved journey against those who went through the old journey.
- Review regularly but don’t overreact: Check metrics weekly, analyze monthly, make strategic changes quarterly. Some improvements take time to manifest.
- Connect metrics to actions: Every metric should inform a potential decision. If a metric can’t influence an action, question whether you need to track it.
A disciplined approach to track customer journey performance keeps your strategy aligned with actual customer behavior and business outcomes.
5 underutilized customer journey metrics
Dr. Zanna van der Aa, one of the leading CX names in the world, lists these five underutilized CX metrics you should be considering while you evaluate customer journey success:
- Total journey time: Measures end-to-end time from the customer’s perspective across all departments, addressing silos that create friction.
- First time right: Tracks the percentage of customer interactions that could have been avoided entirely. In fact, to a question such as “Do you think we could have prevented this call/contact?” 30-40% of customers consistently say YES.
- Simple journey prioritization: Leverage just two data points—customer volume and call generation—to rank improvement priorities.
- Channel penetration rate: Shows what percentage of your customer base uses each channel annually.
- Pareto principle applications: Examine whether 20% of customers generate 80% of calls, 20% of journeys drive 80% of revenue, or whether this pattern flips in certain cases. It’s a quick way to pinpoint the areas with the highest potential impact.
So these complement sales funnel metrics by offering a broader systems view of the end-to-end journey of your customers.
Closing thoughts on customer journey metrics
The metrics outlined here provide your roadmap for customer journey data analysis. Now it’s time to implement them, measure diligently, and let the data guide your improvement efforts. Because in the end, a buyer journey that measurably improves over time isn’t just good for customers, it’s the foundation of sustainable business growth.
Need strategic help with lifecycle marketing? Book a 30-minute, no-obligation call with one of our CRM strategists!
Chintan Doshi - Reviewer
Chintan is the Head of Email & CRM at Mavlers. He loves email marketing and has been in the industry for 7+ years. His track record of email marketing success covers building email programs from scratch and using data-driven strategies to turn around underperforming accounts.
Susmit Panda - Content Writer
A realist at heart and an idealist at head, Susmit is a content writer at Mavlers. He has been in the digital marketing industry for half a decade. When not writing, he can be seen squinting at his Kindle, awestruck.
Mavlers’ monthly MarTech & CRM updates: Aug-Sept-Oct (2025)
RIP N=100 SERP: Here’s Why Your Visibility Data In GSC And SEO Tools Look Different Now